THIS POST IS A QUICK FOLLOW UP to my previous post on forecasting.
I’m not going to add any R code or commentary on graphics, instead I’m just going to leave a few extra graphs related to the prior post. Check out the earlier post for more details on the data and how to build the charts.
Static plots
Here are some static images:
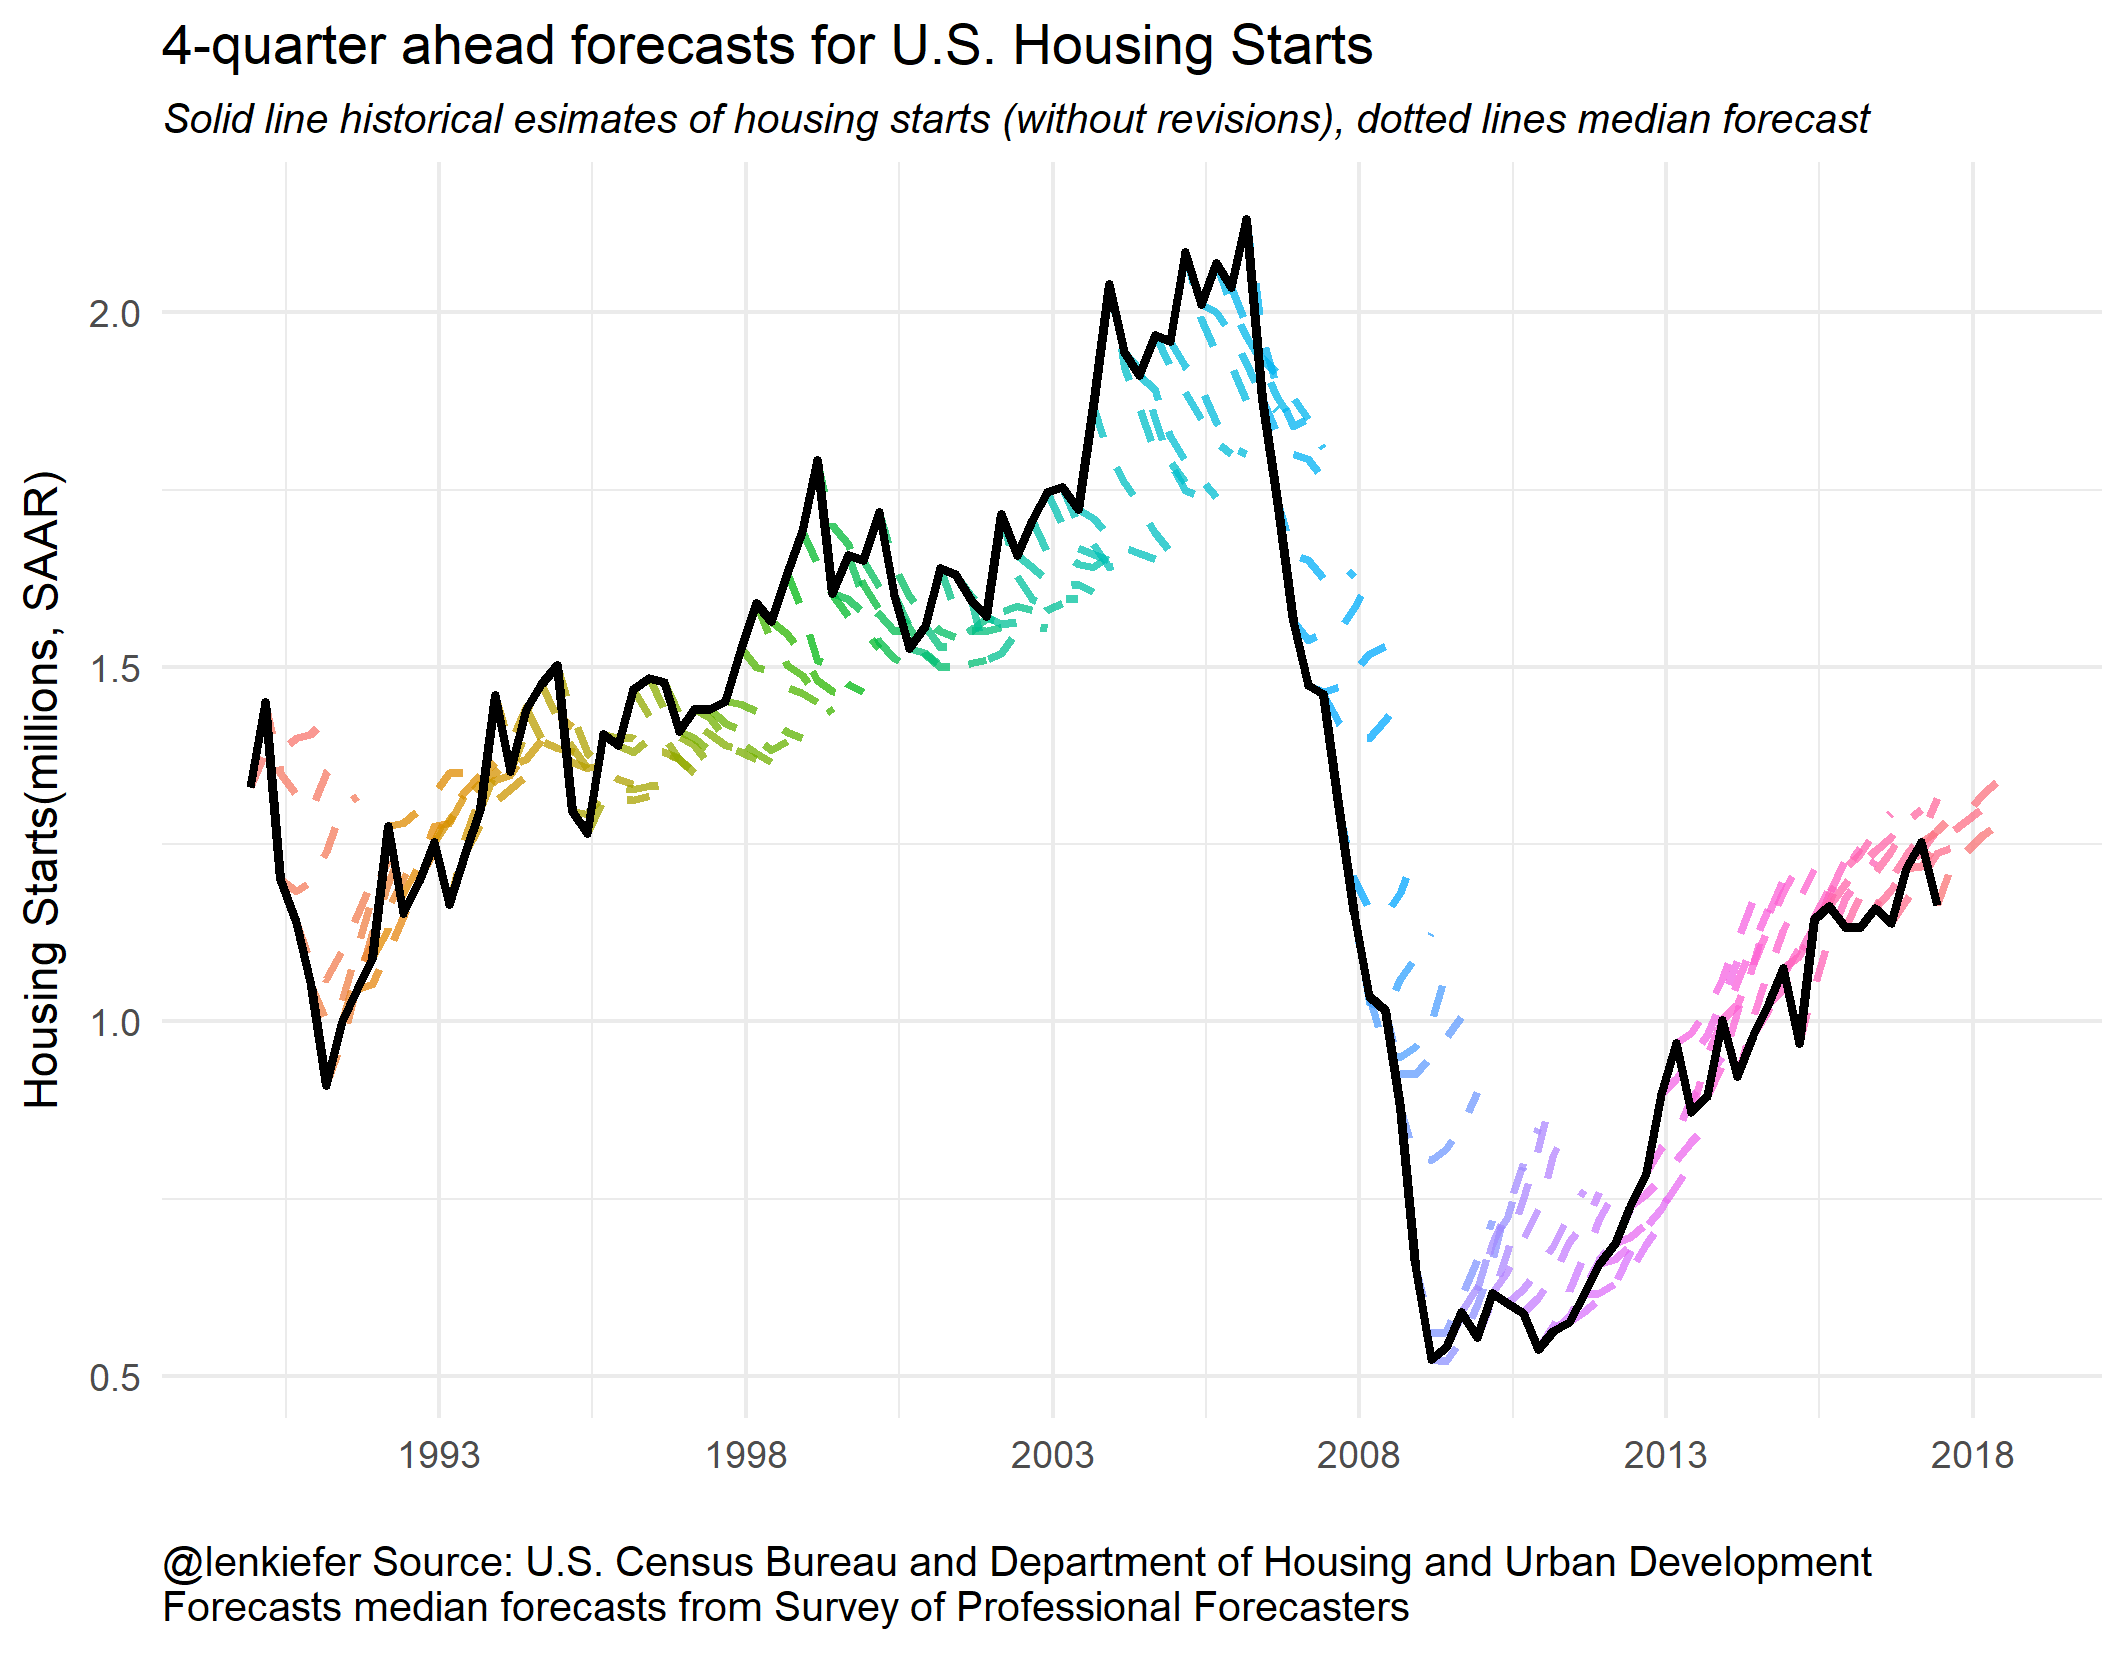
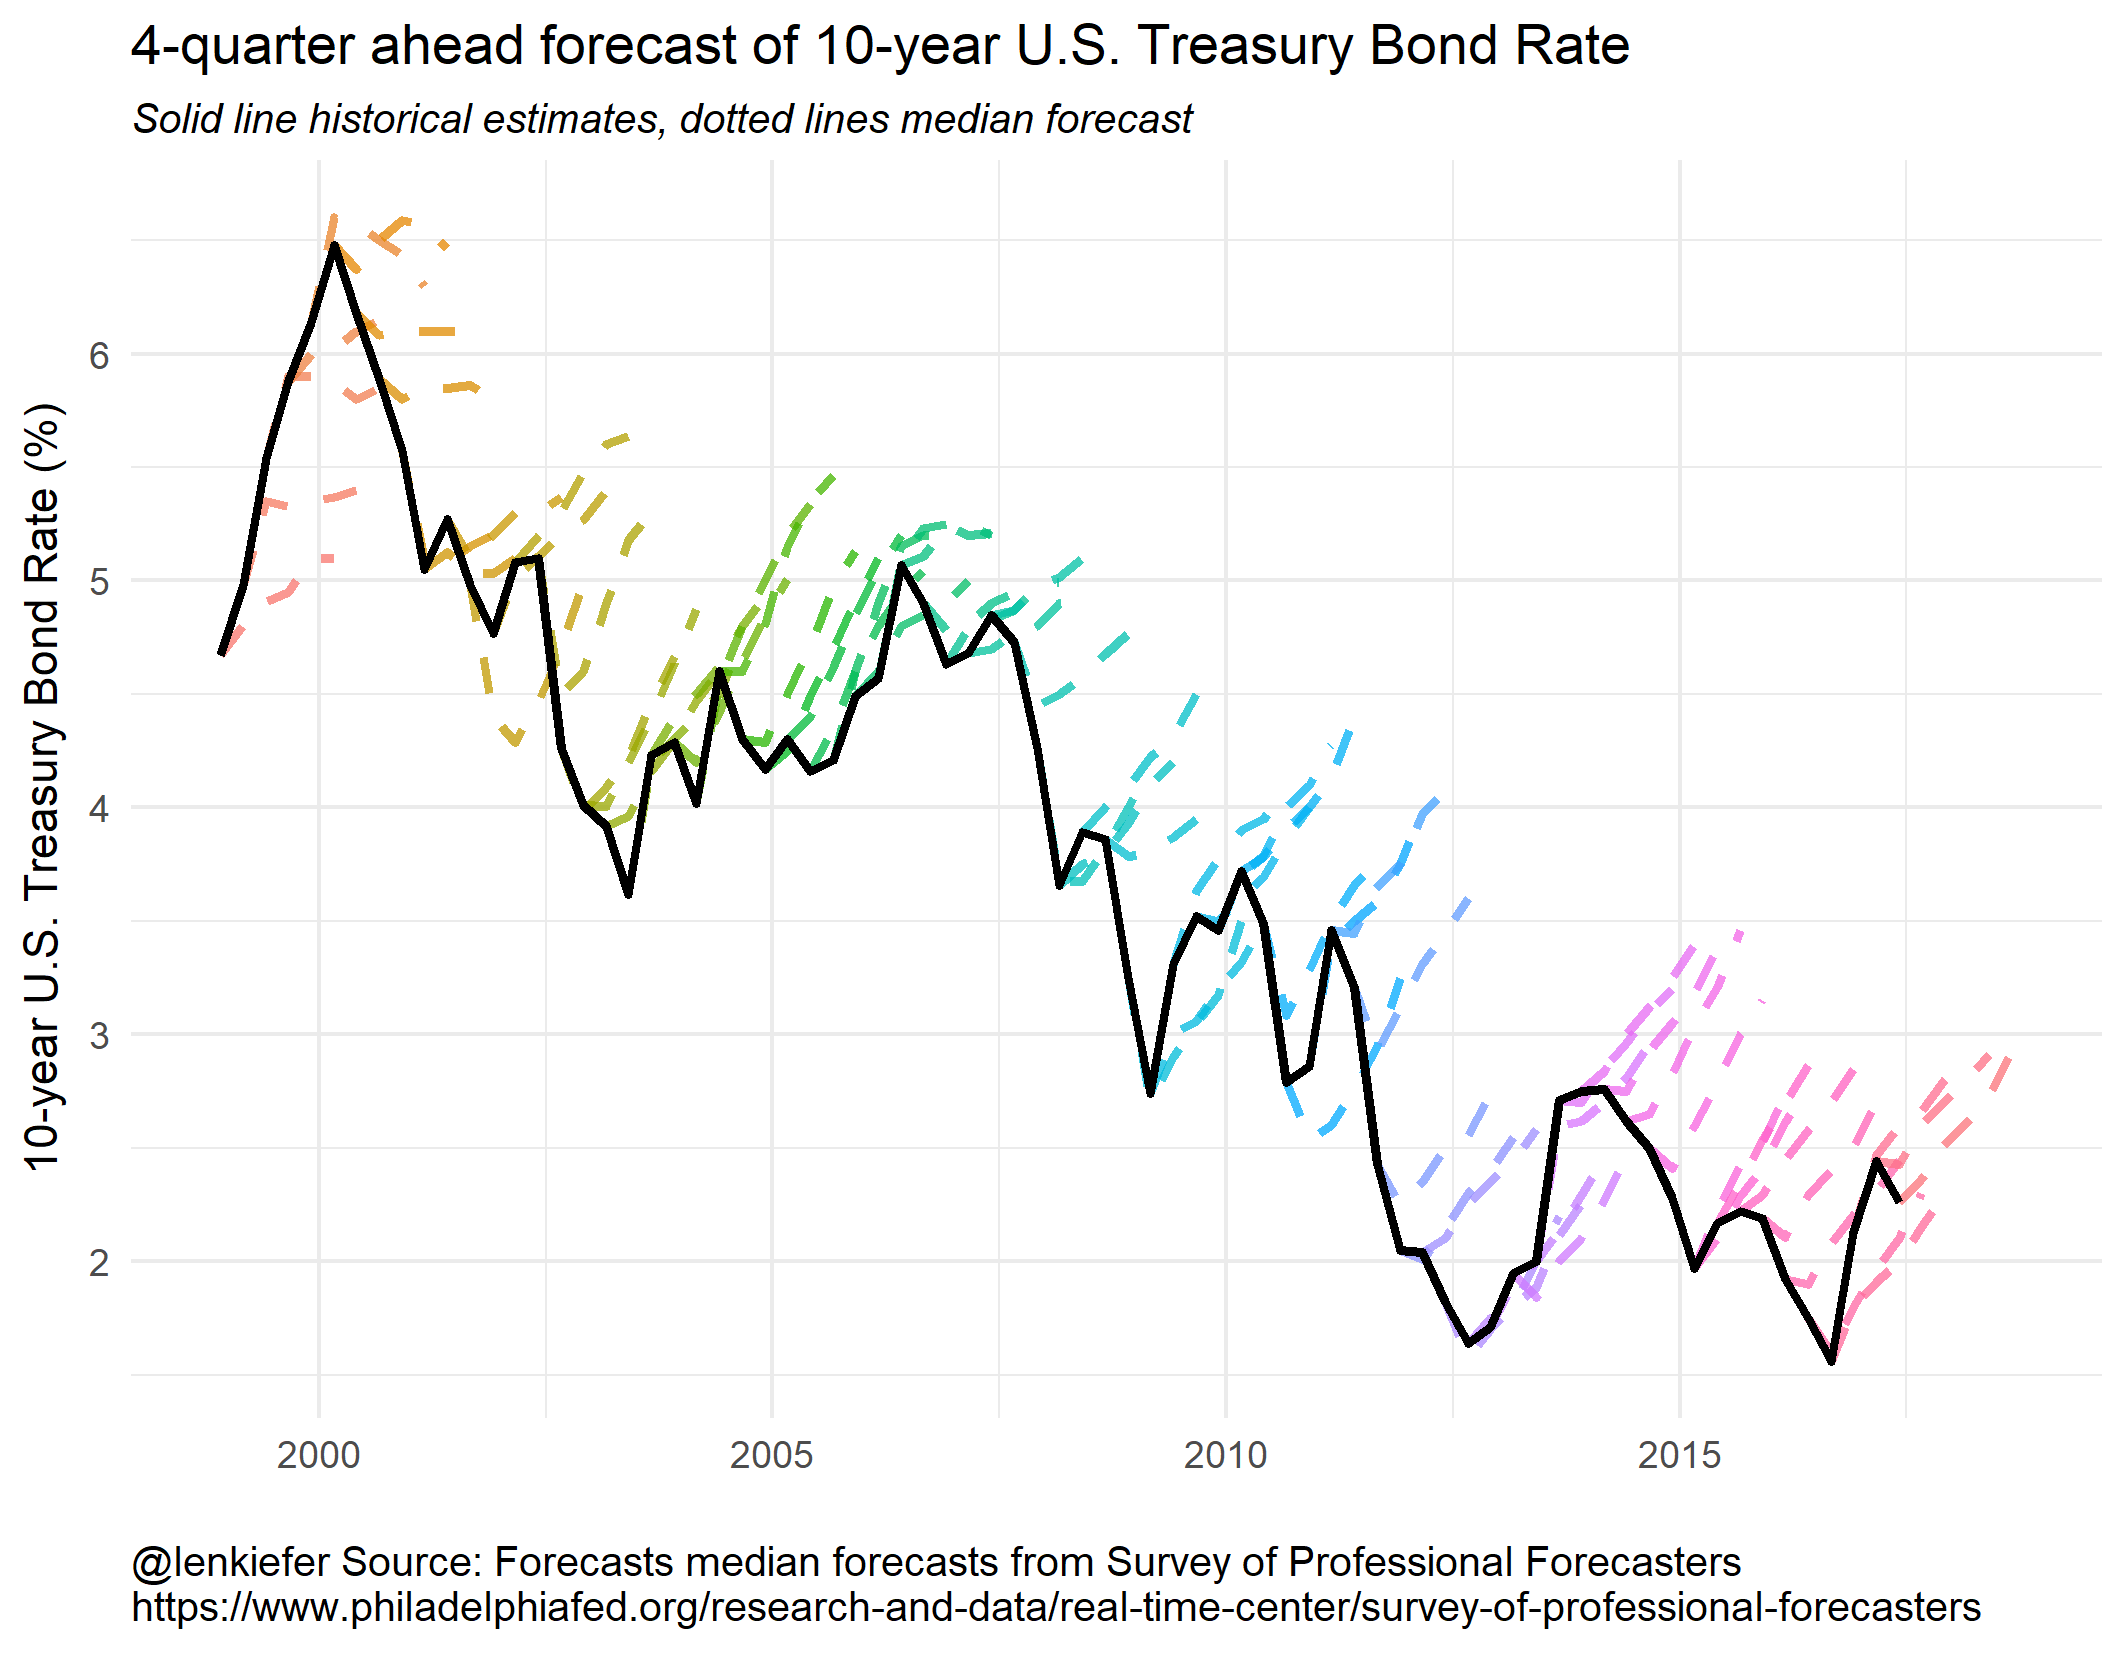
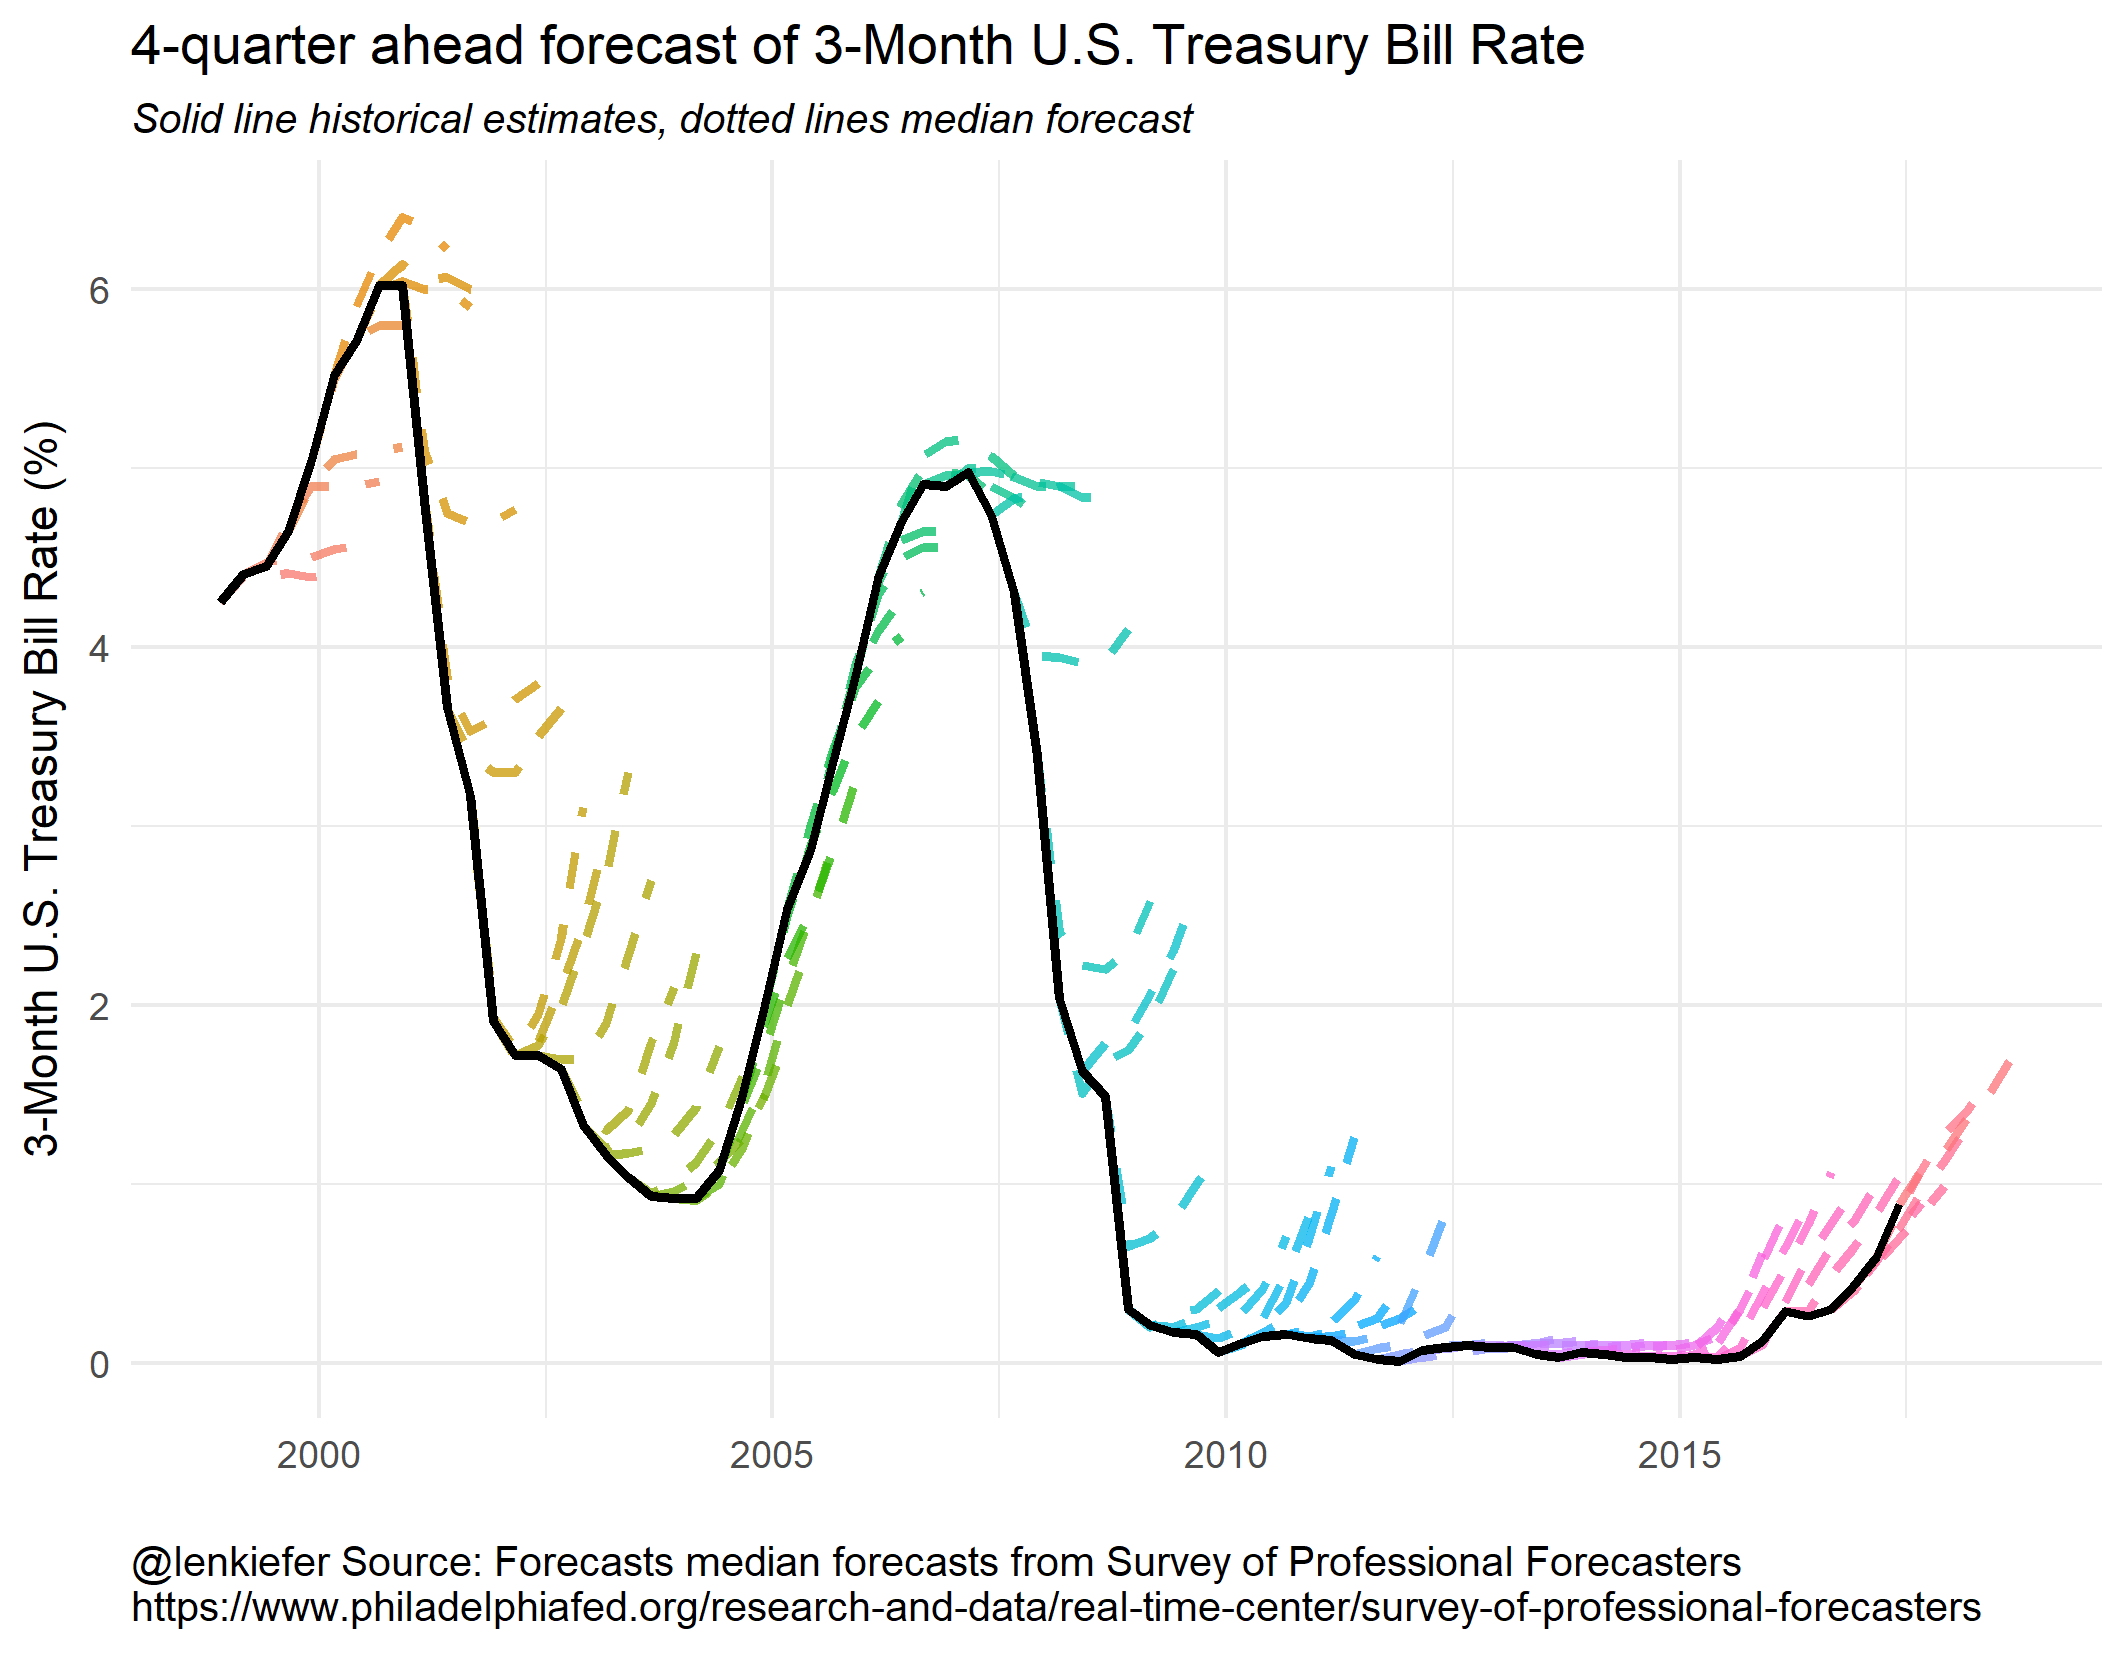
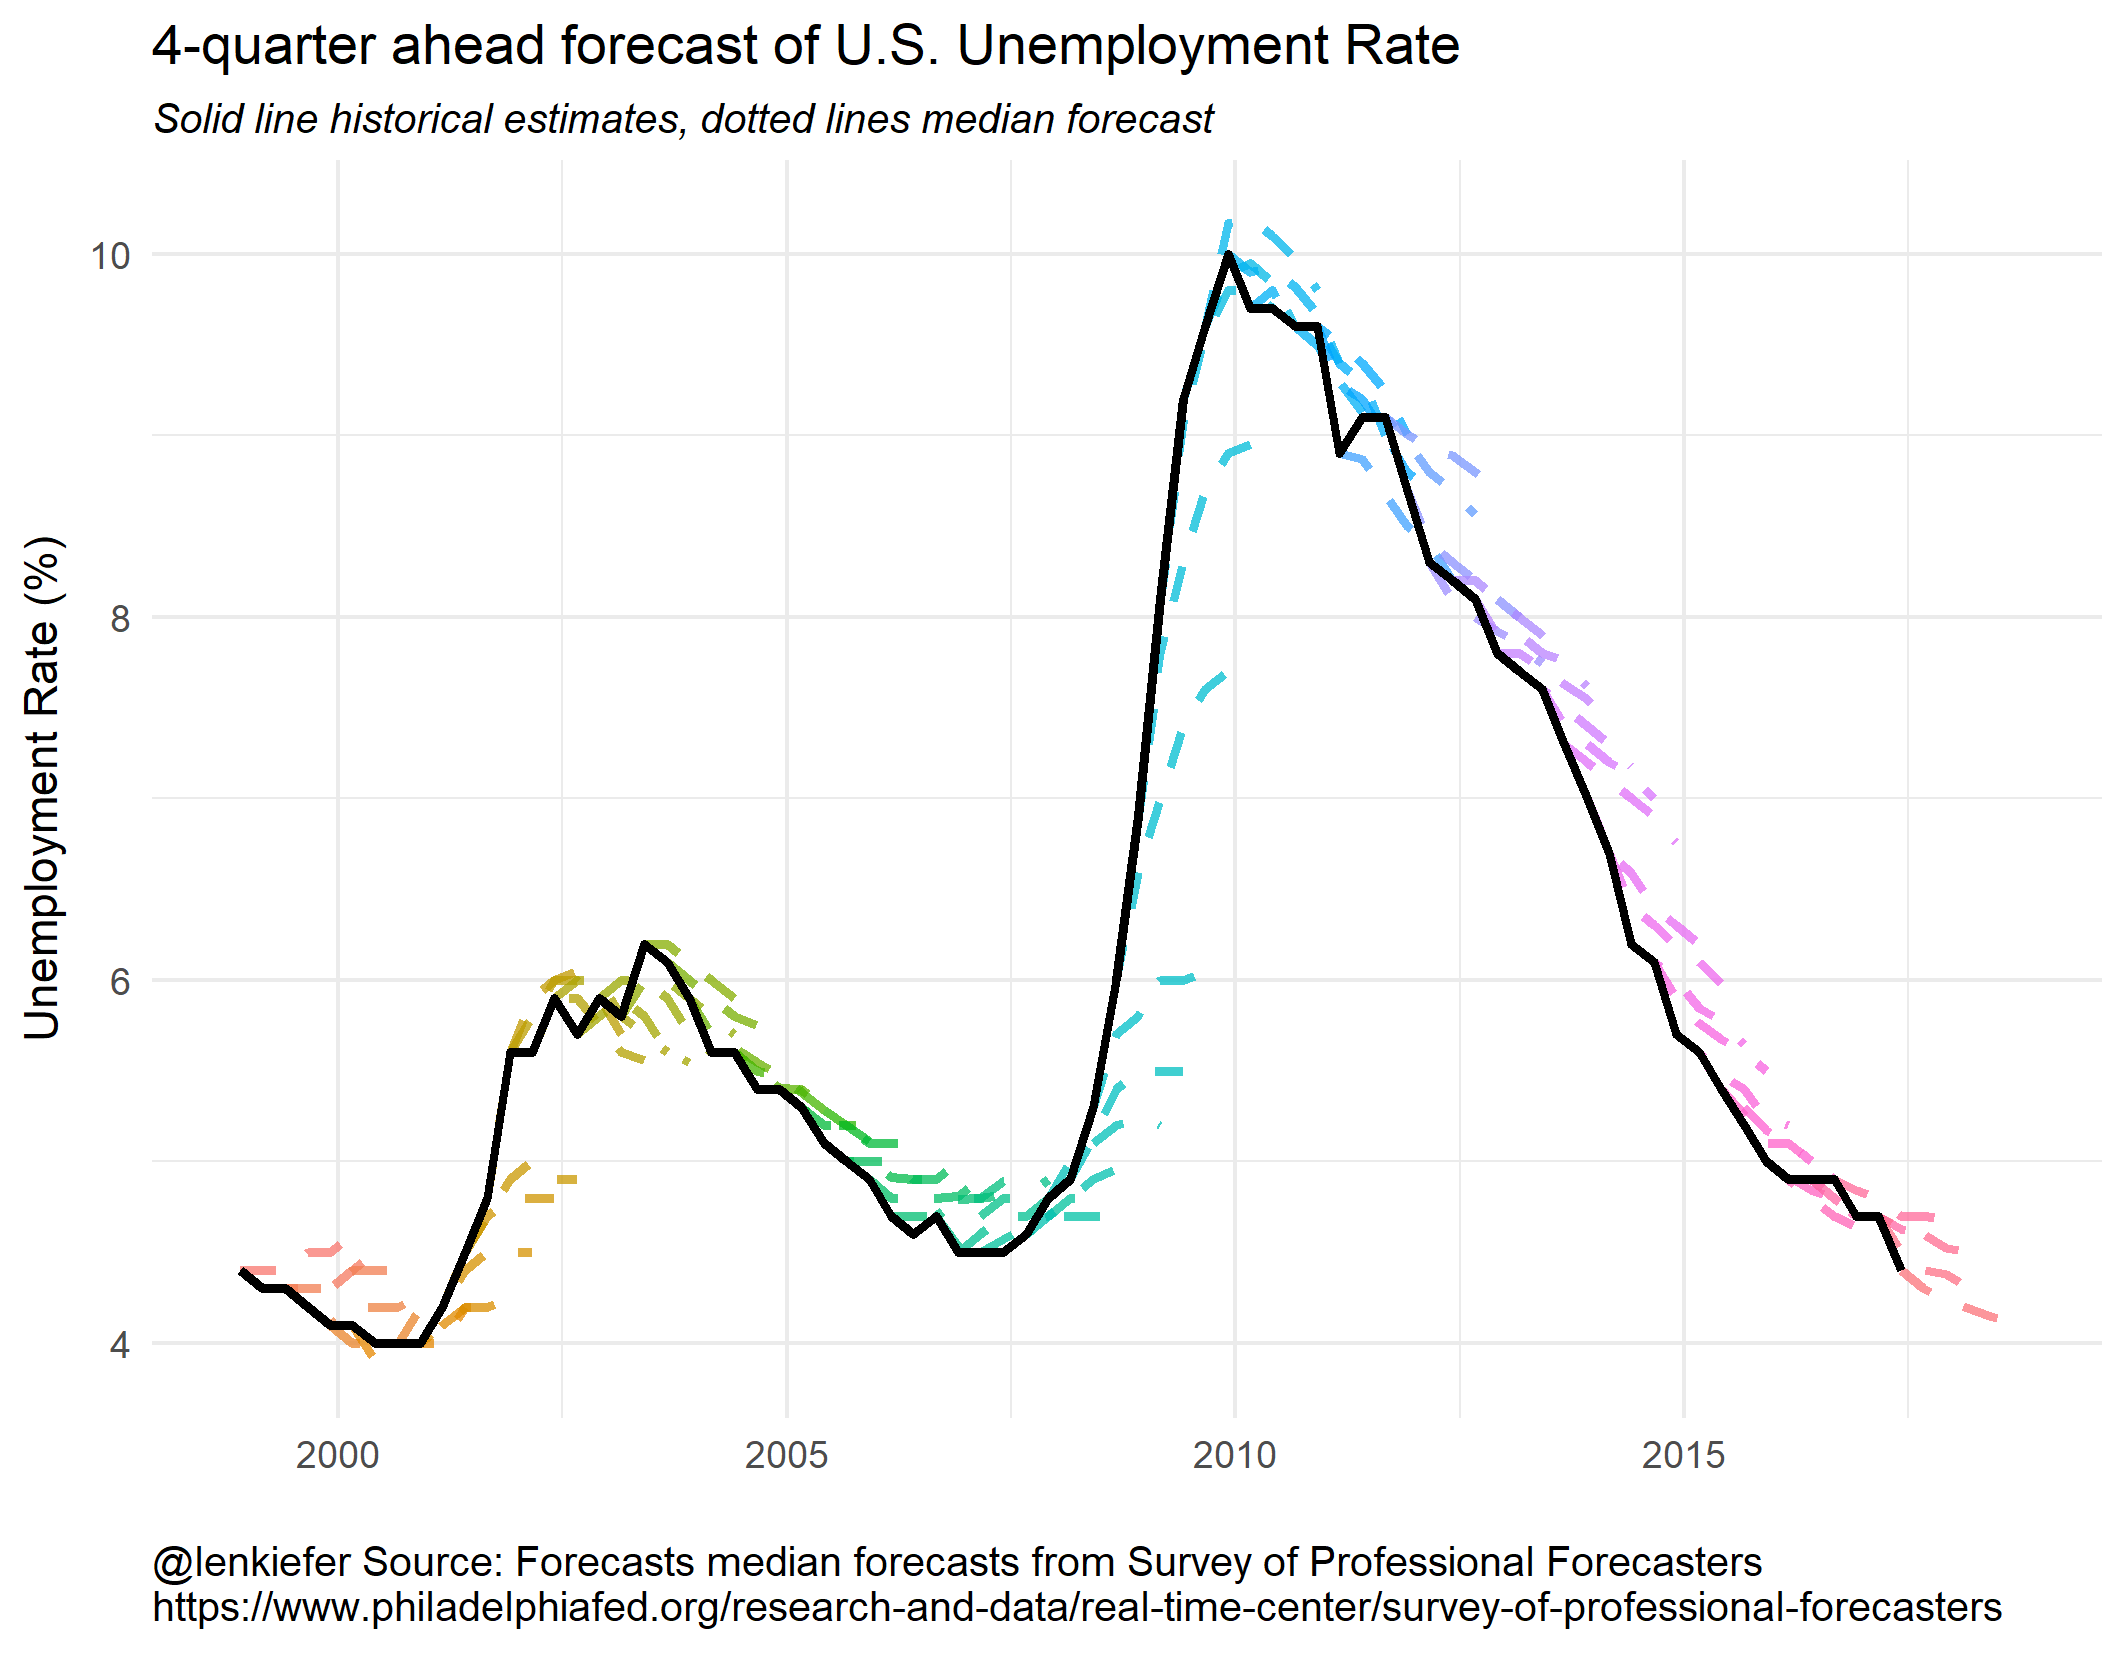
Gifs
And here are associated animated gifs: